


Understand Any Candlestick Pattern
Understand any candlestick pattern is crucial for technical analysis in financial markets, especially in trading and investing. Candlestick patterns provide valuable insights into market sentiment and potential price movements. Here are some steps to help you understand candlestick patterns effectively:
- Learn the Basics: Familiarize yourself with the components of a candlestick. Each candlestick consists of a body and wicks (or shadows). The body represents the price range between the opening and closing prices of a period, while the wicks show the highest and lowest prices reached during that period.
- Recognize Common Candlestick Patterns: Start by learning the most common and reliable candlestick patterns. Some popular ones include:
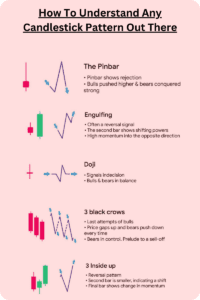
- Doji: Indicates market indecision as the opening and closing prices are very close or identical.
- Hammer and Hanging Man: Both have small bodies and long lower wicks, indicating potential reversals.
- Bullish/Bearish Engulfing: A large candlestick that “engulfs” the previous candle, signaling a possible trend reversal.
- Morning Star and Evening Star: Three-candle patterns indicating potential trend reversals.
- Doji Star: A Doji pattern that appears after an uptrend or downtrend, suggesting a possible trend reversal.

- Understand Pattern Context: Don’t rely solely on the appearance of a single candlestick pattern. Analyze the context in which the pattern appears, such as the prevailing trend, support and resistance levels, and overall market conditions.
- Combine with Other Indicators: Use candlestick patterns in conjunction with other technical indicators like moving averages, RSI (Relative Strength Index), MACD (Moving Average Convergence Divergence), etc. Combining multiple tools can provide stronger signals.
- Practice and Observe: Study historical charts and observe how candlestick patterns played out in various market conditions. This will help you recognize patterns more easily in real-time.
- Consider Timeframes: Remember that the significance of candlestick patterns can vary based on the timeframe you’re analyzing. A pattern that appears on a daily chart may have a different impact than the same pattern on a 5-minute chart.
- Risk Management: Even with the knowledge of candlestick patterns, always implement proper risk management strategies. No pattern guarantees a certain outcome, so be prepared for unexpected market movements.
- Stay Updated: Continue learning and stay updated on new candlestick patterns and their interpretations. Markets evolve, and new patterns may emerge.
- Backtesting and Demo Trading: Before using candlestick patterns in live trading, test your understanding by backtesting with historical data or practice in a demo account.
Remember that candlestick patterns are just one tool in the toolbox of technical analysis. They should be used in combination with other analysis methods to make more informed trading decisions. Additionally, there is no Holy Grail in trading, so always be cautious and avoid making decisions based solely on candlestick patterns.
I am text block. Click edit button to change this text. Lorem ipsum dolor sit amet, consectetur adipiscing elit. Ut elit tellus, luctus nec ullamcorper mattis, pulvinar dapibus leo.