

Demystifying the Double Bottom Reversal Pattern in Forex Trading
Introduction
In the world of forex trading, having a set of reliable tools and strategies is like having a compass in a dense forest. One such powerful tool is the Double Bottom Reversal Pattern. This pattern can help traders spot potential trend reversals and make well-informed trading decisions. In this guide, we will walk you through the world of double bottoms, explaining what they are, how to spot them, and how to effectively use them in your trading journey.
What is a Double Bottom Reversal Pattern?
How the Double Bottom Pattern Forms
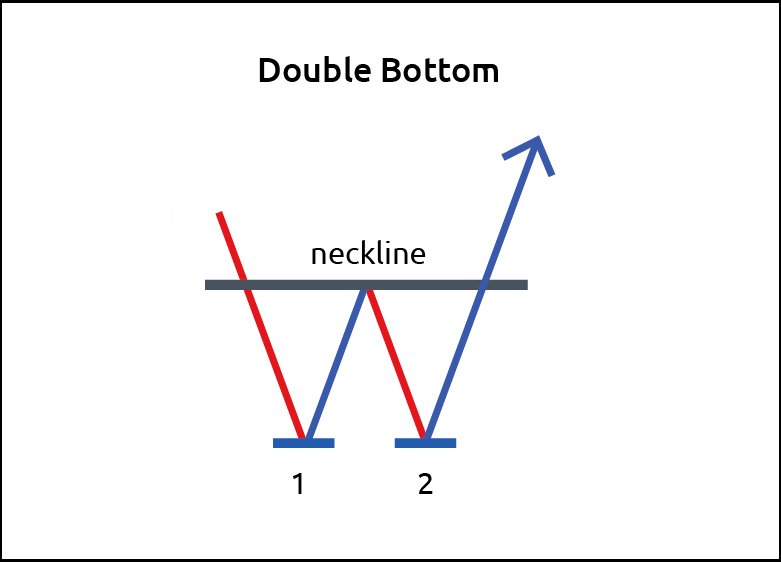
The Double Bottom Reversal Pattern is a friend to traders. It’s a technical analysis pattern that pops up on price charts, and it’s like a signal telling you to look for opportunities. This pattern is a bullish one, meaning it suggests that the market might shift from a downtrend to an uptrend. Imagine the letter “W” when you think of it.
Here’s how the double bottom pattern usually comes to life:
- Downtrend: At the start, prices are on a downswing, indicating a bearish mood in the market.
- First Bottom: Prices hit a low point (the first bottom) and show signs of support. This often comes with more buying interest.
- Peak: After the first bottom, prices bounce up temporarily, forming a peak.
- Second Bottom: Following the peak, prices drop again but don’t dip as low as the first bottom. This signals that the bears are getting weaker.
- Reversal Confirmation: The good news comes when prices break above the peak formed between those two bottoms. That’s the moment the bullish reversal is confirmed.
Identifying Double Bottoms
Recognizing a double bottom pattern on a price chart is an important skill. Here are some pointers to help:
– Symmetrical Shape: The two bottoms should look similar or symmetrical, like a “W.”
– Volume: You’ll often see more trading action when the second bottom forms and during the breakout.
– Confirmation: You can be more certain about the bullish reversal when prices close above the peak between the two bottoms.
Trading Strategies with Double Bottom Patterns
Now that you know what a double bottom reversal pattern is and how it takes shape, let’s talk about using it effectively in your trading strategies.
When to Enter and Exit
One of the main uses of the double bottom pattern is to find the right times to start and end trades. Here’s the game plan:
– Entry: When prices close above the peak formed between the two bottoms, traders often open a long (buy) position, as this confirms the bullish reversal.
– Exit: To figure out when to exit, traders have various tricks up their sleeves, like trailing stop-loss orders or identifying significant resistance levels.
Managing Risk
Just like any other trading strategy, you’ve got to be on top of risk management. Here are some tips:
– Stop-Loss Orders: Setting stop-loss orders is like having a safety net; it limits your losses if things go south.
– Position Size: Decide how big your position should be based on your comfort with risk and the size of your account.
– Diversify: Don’t put all your eggs in one basket. Spreading your investments reduces risk.
Real-Life Examples
Let’s look at a couple of real-world examples to see how the double bottom reversal pattern plays out.
Example 1: EUR/USD Currency Pair
Take a look at this daily chart of the EUR/USD currency pair. It’s like a double bottom pattern showcase with two lows (bottoms) and a peak in between. Traders who spotted this pattern and jumped in when prices closed above the peak could’ve ridden the uptrend that followed.

Example 2: Gold Futures
Now, here’s a 4-hour chart of Gold Futures. Once again, the double bottom pattern is there for the taking. Traders who recognized it and entered at the right time might have enjoyed the price turnaround.
Pros and Cons of Using Double Bottoms
Before you commit to using any trading strategy, you need to know the perks and pitfalls.
Pros:
- Signal of Reversal: Double bottom patterns give a clear sign that the trend might be turning, helping you make wise choices.
- Risk-Reward Balance: By pinpointing entry and exit points, you can manage your risk-reward ratio effectively.
- Versatility: These patterns can fit into various timeframes, making them handy for short-term and long-term traders alike.
Cons:
- False Signals: Like any tool, double bottoms aren’t perfect. Sometimes they give false signals.
- A Dash of Subjectivity: Spotting double bottoms can be a bit subjective. Different traders might see them differently.
- Market Matters: How well double bottom patterns work can depend on market conditions and other factors.
Conclusion
In the forex trading world, being able to spot a trend reversal and act swiftly is golden. The Double Bottom Reversal Pattern is a powerful ally for traders. By grasping how it forms, recognizing it on price charts, and using smart trading strategies, you can boost your trading game and potentially increase your gains.
Include the double bottom pattern in your trading toolkit, but don’t forget the golden rules of risk management and doing your homework. Happy trading!
Frequently Asked Questions
- What’s a double bottom reversal pattern in forex trading?
It’s a bullish pattern on price charts with two lows separated by a peak, signaling a potential shift from a downtrend to an uptrend.
- How can I spot a double bottom pattern on a price chart?
Look for a “W” shape formed by two lows with a peak in between. Be confident in the bullish reversal when prices close above the peak.
- What are some trading strategies for double bottom patterns?
Traders use these patterns to decide when to enter and exit trades. They enter long positions when the bullish reversal is confirmed and use various methods to set exit points.
- Are there risks involved in trading double bottom patterns?
Yes, like all strategies, double bottoms can occasionally give false signals. It’s essential to manage risk and consider market conditions.
- Can double bottom patterns be used on different timeframes?
Absolutely. They’re flexible and can be applied to both short-term and long-term trading strategies.